The biggest myth in property is that residential properties double in value every 7 to 10 years.
In this article:
Article originally posted on YourInvestmentPropertyMag.com.au (YIP).
It’s such a gross generalisation that, while true occasionally, is not true for the majority of the properties in the market for the majority of the time.
An equivalent statement would be that all houses in Australia have either red or brown roof tiles. Sure, there are some houses that do, but that doesn’t mean that all houses do.
Blindly accepting that prices will double every 7 to 10 years leads people to make grave mistakes with their investments. Nobody has a crystal ball that tells them the exact dollar value of a property 10 years from now, but that doesn’t mean that smart investors can’t establish reasonable grounds for predicting the direction and strength of market movements in the short to medium term.
But, before I share the framework that I used to beat the market by 25.8% since December 2011 (when we started tracking our portfolio’s quarterly movements), let’s consider the grounds for the “7-10 year myth.”
The 7-10 Year Myth
In the 1980s, before he bought his first investment property, my dad was awestruck with the notion that house prices double every 7-10 years. This one concept alone motivated him to take up a second job to save a deposit and buy his first investment property. At the same time, he started sharing his knowledge with my brother, Al, and I so that we could benefit from the great financial wonder that was the doubling in the price of houses like clockwork.
Without a shadow of a doubt, I believed the myth too. It helped me to overcome my fear of loss when Al and I bought our first property when I was just 18 years of age. We grew our portfolio through the boom of the 2000’s, the uncertainty of the GFC, and the mini-boom that followed. Despite a few bumps along the way property prices marched steadily on and the myth continued.
But with each passing year I began to wonder: “Do prices really double every 7-10 years and, if so, why?”
The following chart, which is based on median house price data from Sydney over the last 53 years, shows the growth rate for different periods (i.e. 5, 7, 10, 12 and 15 years) to determine how long it actually takes for prices to double.
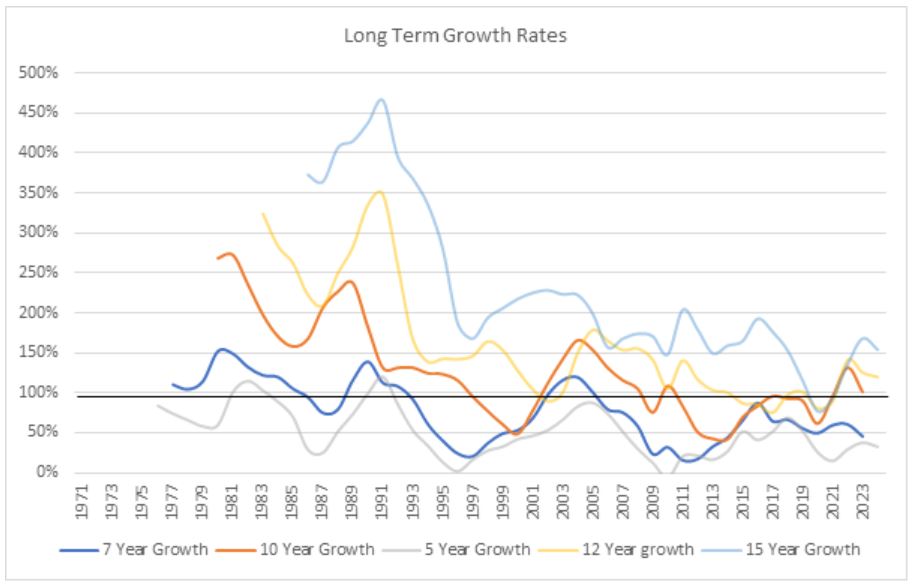
(Sources: ABS, McCrindle Research, OpenCorp)
What we can see from this chart is that:
- Between 1970 and 1990, prices mostly doubled in less than 7 years.
- From 1990 to 2009, prices mostly doubled in less than 10 years.
- From 2009 to 2015, prices mostly doubled in 12 years; and
- From 2015 to 2020, it took 15 years for property prices in Sydney to double.
Similar trends can be seen in most other capital cities. So, while the 7-10 year myth was true for a long time, it is no longer true.
So, while Australians created more wealth from property in the 2010s than in any decade before, the property market underperformed relative to previous decades.
Now, the logical questions from here are:
- Why is it taking longer for house prices to double; and
- What does this mean for the next 7 to 10 years?
A Model of the Australian Housing Market
In 2015, the Reserve Bank of Australia undertook a major review of the drivers of the housing market. They found a strong correlation between inflation and house prices until the late 1990’s:
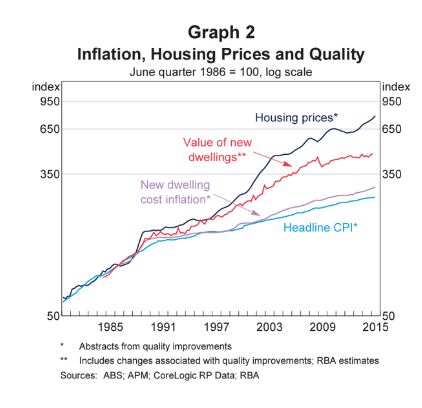
The above chart indicates that the rising cost of delivering new dwellings also increases house prices faster than inflation on its own. While not immediately considered in the RBA report, the cost of delivering new dwellings has been impacted significantly over the last 3 decades by:
- Changes to the planning system with urban growth boundaries reducing developable land and increasing the price of house and land packages.
- New design standards imposed by councils and building regulators, with higher energy efficiency, car parking and visual appeal all add to the cost of construction.
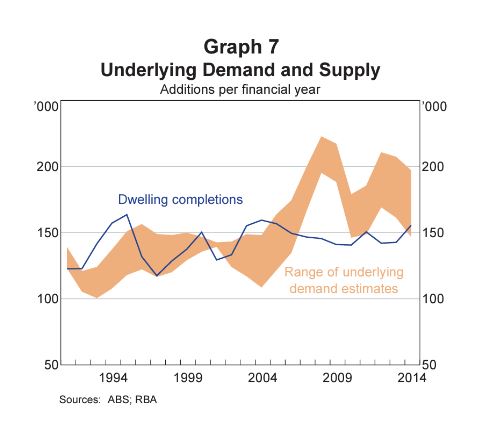
Another driver of house prices over and above inflation was found to be caused by underlying demand outpacing supply. The following chart, taken from the same report, shows that since the mid-90’s demand has largely outpaced dwelling completions.
Nonetheless, these charts don’t make it clear why the pace of house price growth has slowed down. To understand that it is relevant to look at inflation over the last 50 years:
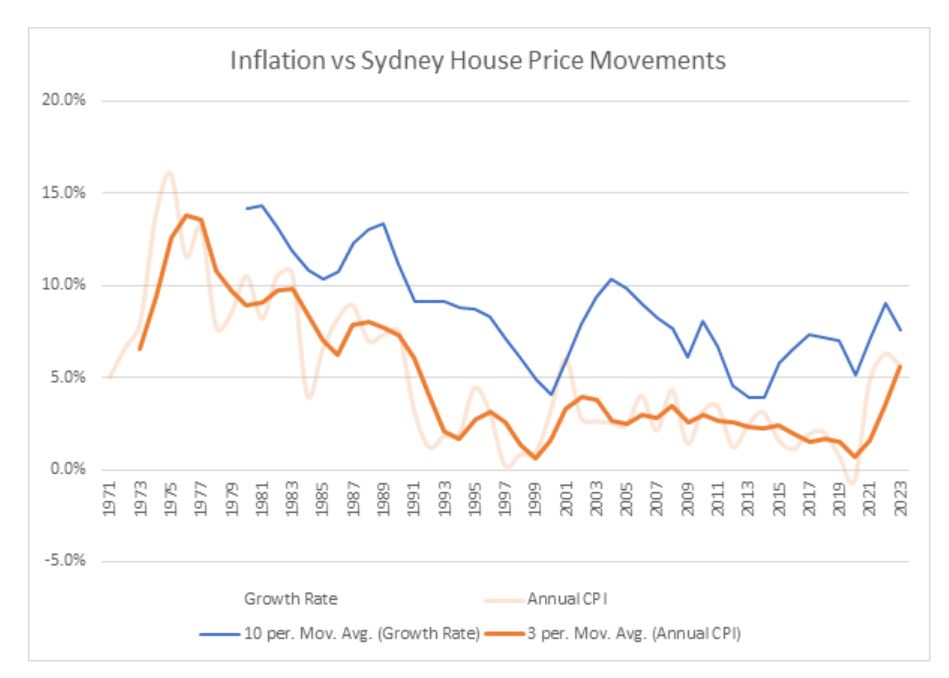
The chart shows that the 10-year growth rate in house prices in Sydney (for example) lags the 3-year inflation rate. So, when inflation was really high in the 1970’s and 80’s, house prices were growing much faster than during the 2000’s and 2010’s when inflation was quite low and stable. As a result, the rate of house price growth slowed down.
This makes sense because wage growth often follows inflation and the cost of replacing old dwellings with new homes also increases, thereby lifting the “floor” of the market and making established houses appear more attractive.
Another factor has been the effect of APRA’s regulation of the banking industry, which saw much tougher lending standards applied in the last 7 years.
So, what does this all mean for the 2020’s?
The Outlook
Putting the pieces of the puzzle together, we know that house prices grow faster when:
- Underling demand (i.e. population growth) exceeds supply;
- Inflation is higher;
- The cost of building new properties increases.
While there are other short-term factors, like consumer sentiment and interest rates, these are generally the result of the above factors.
While the 2010’s was marked by a period of low inflation, thanks to Covid the 2020’s has already seen the biggest bout of inflation in around 30 years. While inflation is dropping, it is not expected to fall below 3.00% until late 2025, suggesting that the 3-year inflation rate will remain high for the majority of the decade.
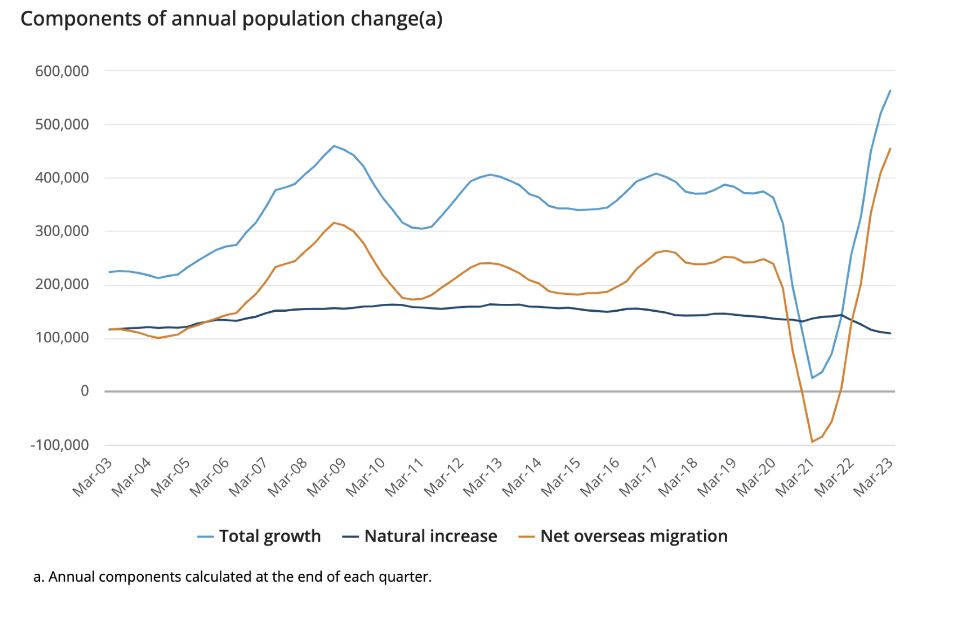
At the same time, Australia’s population is booming. In the year to March 2023, Australia had record population growth.
The other side of the equation, supply, is also severely impacted. So much so that the Federal Government has established a taskforce to try to address the issue. They have set a target of 1.2 million new homes to be produced in the coming 5 years, which would be a 37% increase on the current rate of new home construction. Industry experts believe this is an impossible task, given that it would require a massive increase in the size of the construction workforce and supply of materials, not to mention an overhaul of the planning system which has constrained supply for decades.
This is also where APRA’s tougher lending standards imposed in the 2010’s may come back to bite them. While these tighter lending standards slowed down house price growth when they were imposed, they also impacted the number of new housing developments that could commence (due to pre-sales being harder to achieve). This, in turn, saw a slow-down in new housing construction which has ultimately led to the massive undersupply in rental accommodation that we are now experiencing. In order to increase the number of new homes built to address the supply shortage, APRA may be forced to reduce the lending buffer, or the RBA will need to reduce interest rates, thereby putting more upwards pressure on prices.
So, by and large, Australia’s housing market is positioned for much higher growth in the 2020’s than was seen in the last decade. In fact, there is a high probability that price growth could exceed that experienced in the 2000’s and the 7-10 Year Myth will once again become reality.